
How Cost & Accessibility Shape City Choice for Gen Z [Vol 1.]
![How Cost & Accessibility Shape City Choice for Gen Z [Vol 1.]](https://storage.ghost.io/c/2a/15/2a15a088-2f8f-4b4b-bbdf-dcb7541d59b1/content/images/size/w1200/2026/02/nano-banana-2026-02-03T10-53-01.png)
Seoul vs Busan, with Berlin–Frankfurt and New York as Global Benchmarks
This is not a city recommendation guide.
It is a navigation framework that lowers the analytical scale from
nation → city → individual (in-bound Gen Z),
allowing European Gen Z readers to calculate costs and risks for themselves.
City choice is no longer a matter of taste.
It is a calculation of opportunity versus downside risk.
Opportunities are highly personal; costs, however, can be structured through data.
I. Macro Perspective: Why Korea Becomes a Candidate
Before comparing cities, we first establish the national floor—the baseline conditions that make city-level comparison meaningful.
1) National Scale: Is the System Big Enough?
For European Gen Z, the key question is whether it offers sufficient market size, institutional depth, and infrastructure to make risk-taking viable.
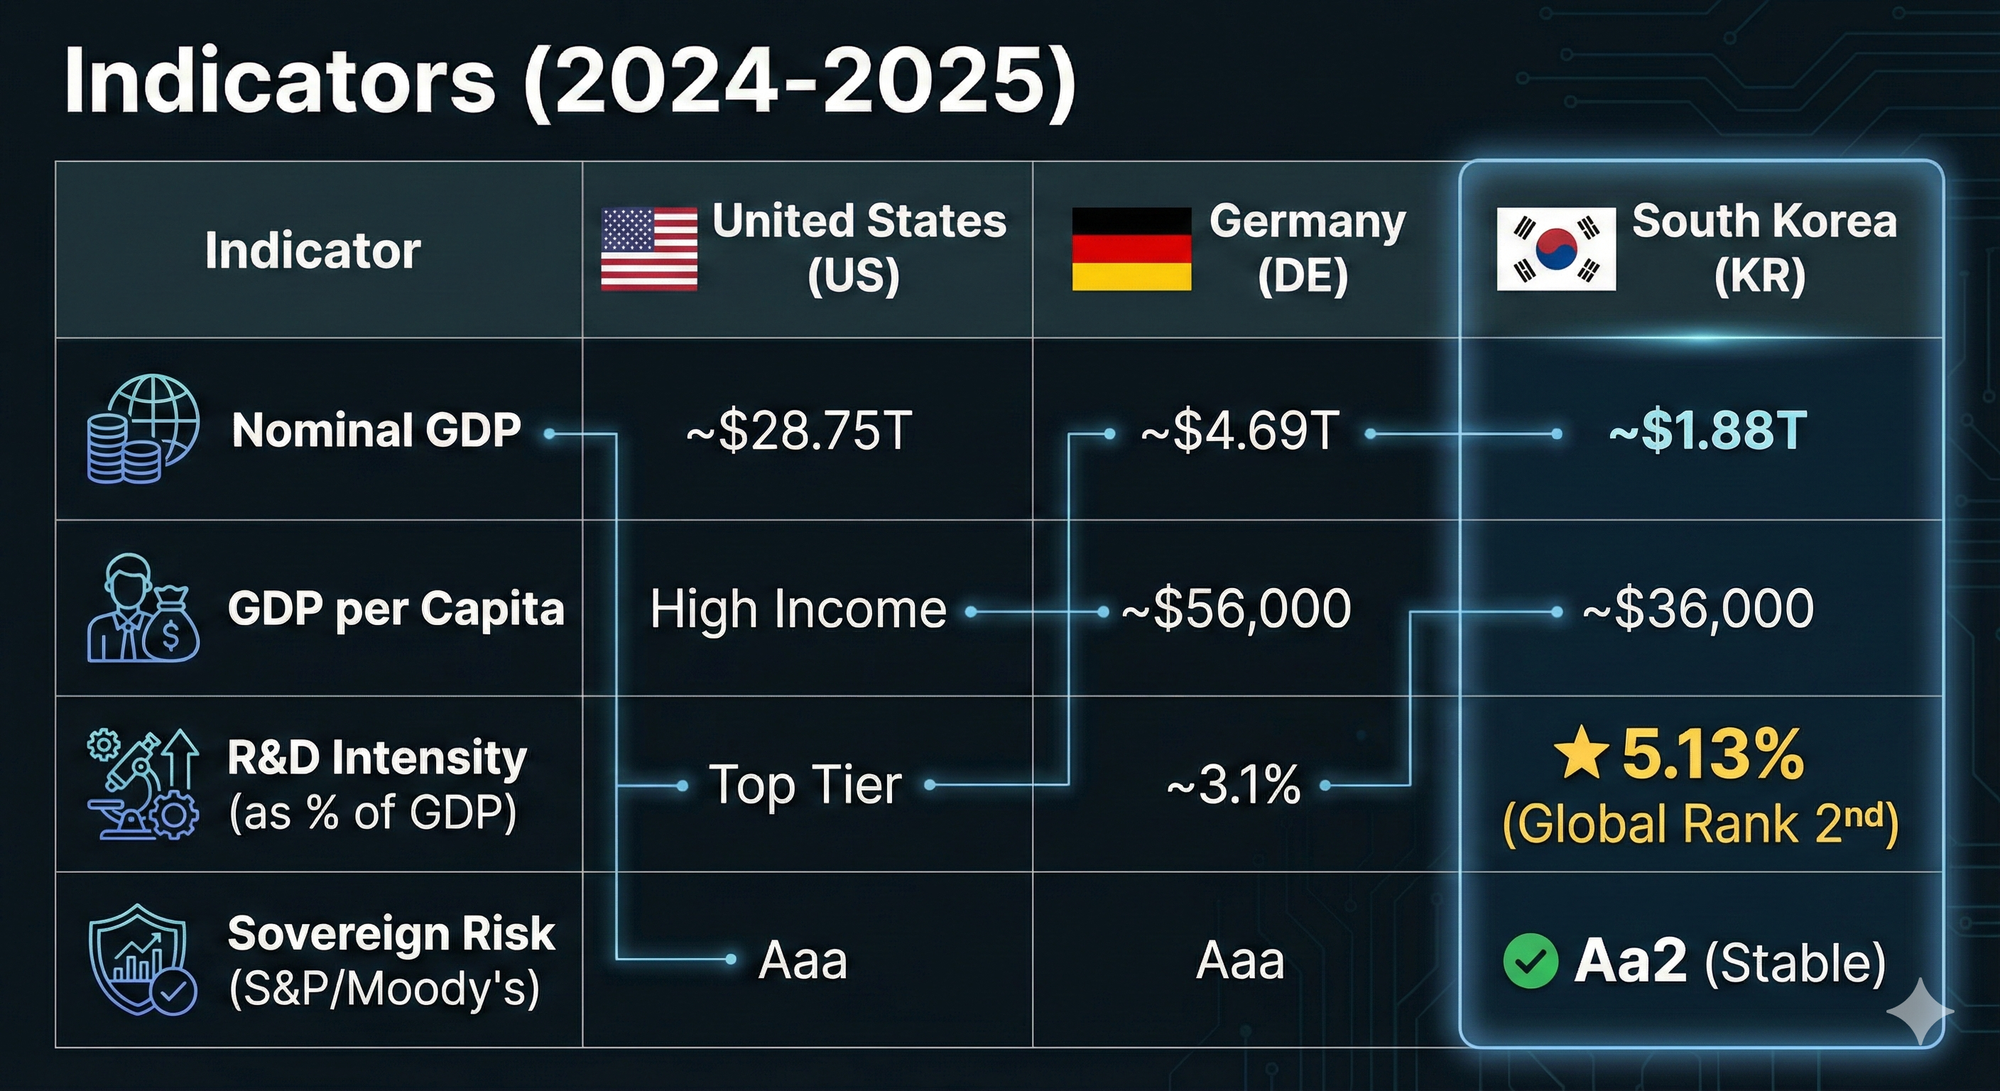
This places Korea neither among developing economies nor ultra-high-income countries, but squarely within the middle tier of advanced economies.
This is precisely where city-level cost comparisons become meaningful.
3) Future Competitiveness: R&D Intensity (Innovation Speed)
Korea’s structural strength lies in R&D intensity, not sheer scale.
- R&D/GDP (2024): 5.13% (around 2nd globally)
While smaller than the U.S. in absolute terms, Korea ranks among the top OECD countries in R&D intensity relative to economic size.
- Government R&D budgets for 2025–2026 increased by ~19–20% year-on-year
- Heavy concentration in AI, semiconductors, advanced biotech, and next-generation communications
- A medium- to long-term investment framework led by the Ministry of Science and ICT has been finalized
4) National Risk: System Stability
Korea is not on par with Germany, but it clearly belongs to the high-grade investment category, with relatively low systemic risk from an urban residency perspective.
Macro Summary
Based on international indicators (OECD, World Bank), Korea is a country where accessibility and predictability relative to risk can be calculated.
This makes it a valid starting point for city-level comparison.
II. Micro Perspective: From Nation to City
1) Benchmark: New York = 100
In city comparisons, relative indices offer greater reproducibility and explanatory power than absolute prices.
The global benchmark in this analysis is New York = 100.
2) Data Principles
- Official frameworks: World Bank, OECD
Urban nowcast (cost perception): Numbeo (supplemented by Expatistan, LivingCost.org)
- Numbeo → urban price levels
- PPP → income and purchasing power
- CPI → time alignment
III. City Cost Comparison
This percentage difference is converted into the same Numbeo framework (New York = 100), resulting in a Busan index of approximately 40.6.
This is not an estimate, but a direct application of Numbeo’s internal comparison logic.
Structural Interpretation
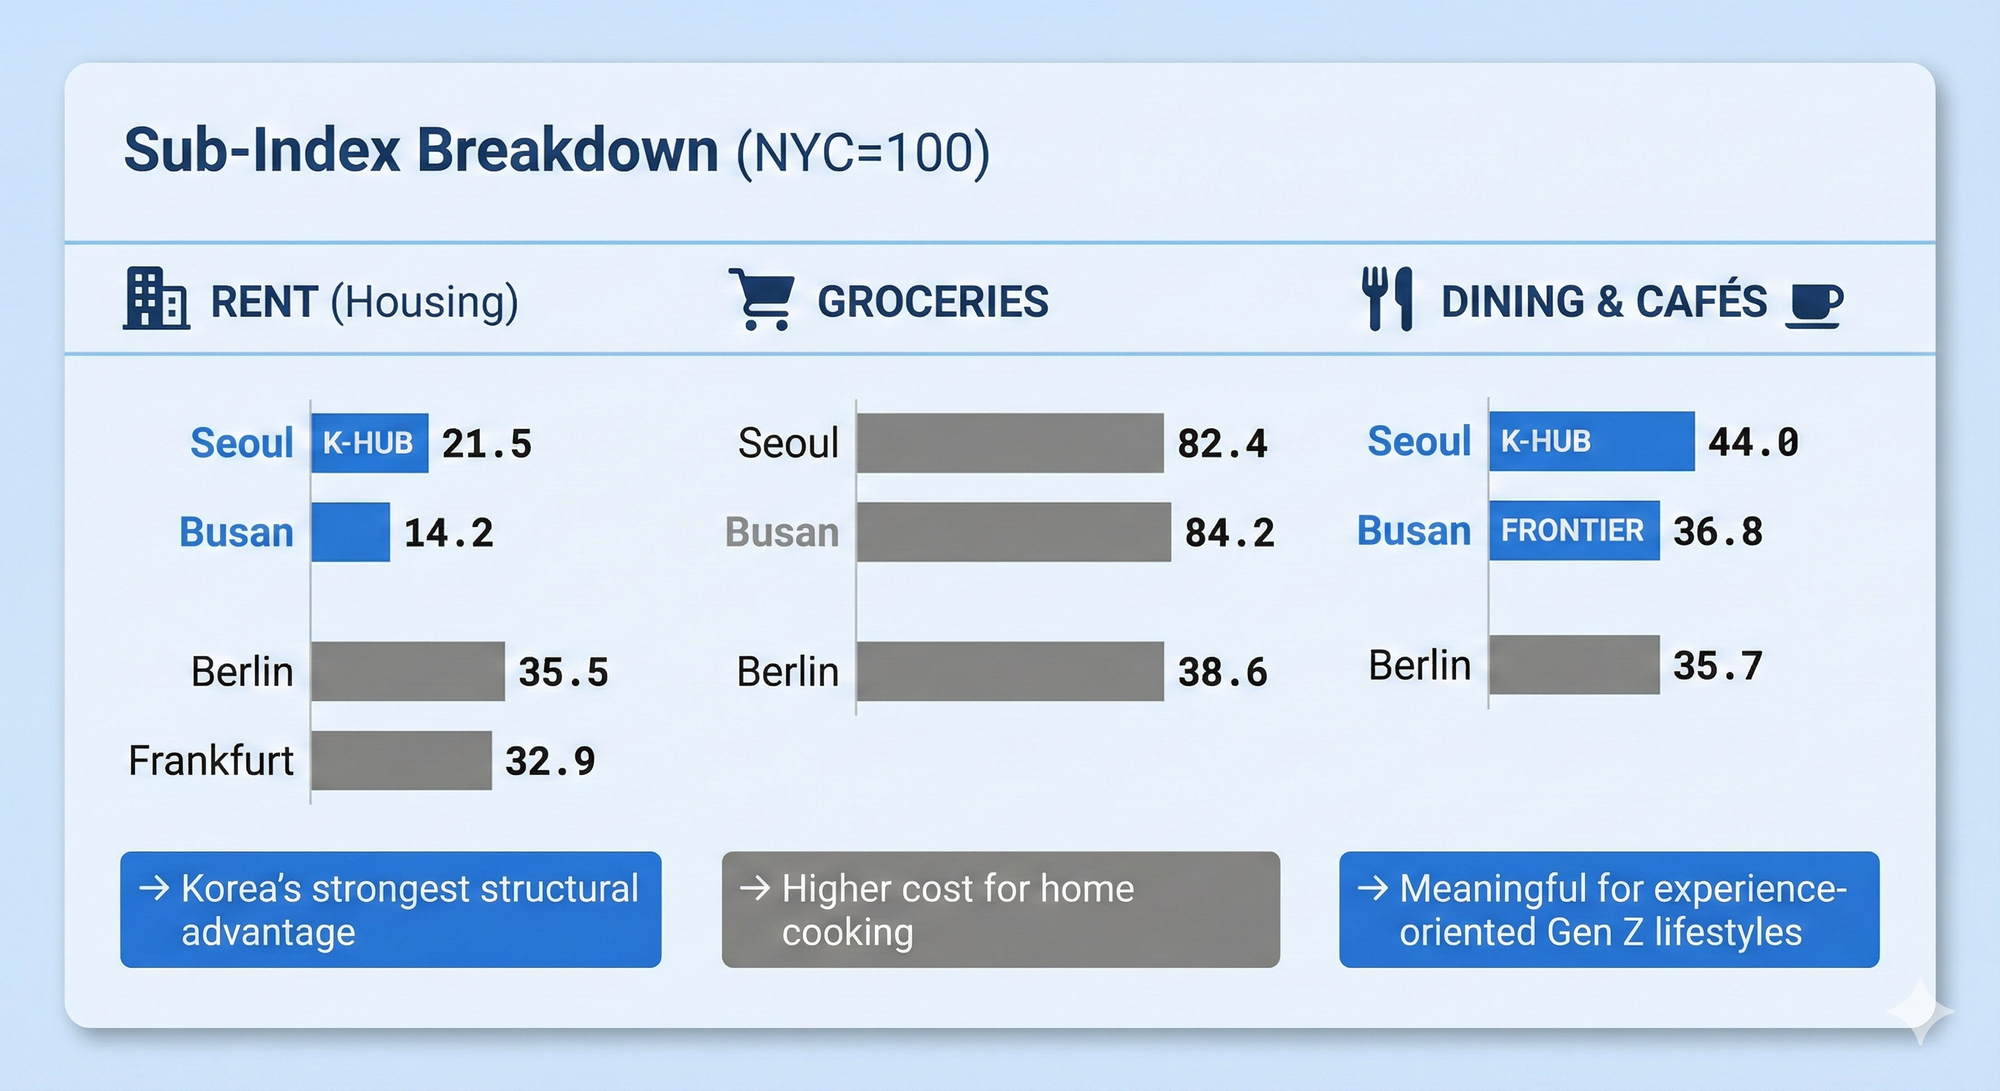
- Housing (rent) shows the strongest structural advantage for Korean cities
- Groceries are relatively higher in Korea
- Dining & cafés are significantly cheaper
This pattern directly aligns with Gen Z’s city usage style, which emphasizes eating out and experiential consumption.
Interpretation
- Home Cooking in Korea Is Not a Cost-Saving Strategy
- Europe: Home cooking → cost reduction
- Korea: Meals based on rice and side dishes → higher time, labor, and ingredient management costs
- Result: Many Korean Gen Z and foreigners adopt a mixed pattern: weekdays eating out or delivery, weekends partial cooking
- Implication: Actual living costs are better reflected by the Dining & Cafés index (Seoul 44.0 / Busan 36.8)
In the next volume, we will dive into Korea’s structural specificities—examining how daily routines, housing, and consumption patterns influence actual living costs, and what that means for European Gen Z navigating their own city decisions.
Dawn Chang, PhD · Editor-in-Chief, K-Welle · editor@k-welle.com